Getting started aims to get the end user up to speed using the GeoContext API quickly. The GeoContext API aims to provide the user with multi-contextual data for a specific point. GeoContext implements various standards as well as specific services in order to return the data as specified in your database and returns a single value for each Context Service
This documentation is designed for people familiar with JavaScript programming and basic object-oriented programming concepts. Basic knowledge of GIS (Geographical Information Systems) may prove useful, but it is not critical.
The GeoContext rest API accepts a GET request and
delivers JSON data. The simplest way to see it in
action is to simply open the following in your
browser
https://staging.geocontext.kartoza.com/api/v2/query?registry=group&key=rainfall_group&x=24.0380859375&y=-29.375038630898835&outformat=json
Or for convenience as GeoJSON:
https://staging.geocontext.kartoza.com/api/v2/query?registry=group&key=rainfall_group&x=24.0380859375&y=-29.375038630898835&outformat=geojson
So, we all like JSON, but what is really going on here? In order to appreciate the scope of GeoContext we shall consider a quick overview of how the calls are laid out.
There are 3 hierarchical levels:
- Context Service
- Context Group
- Context Collection
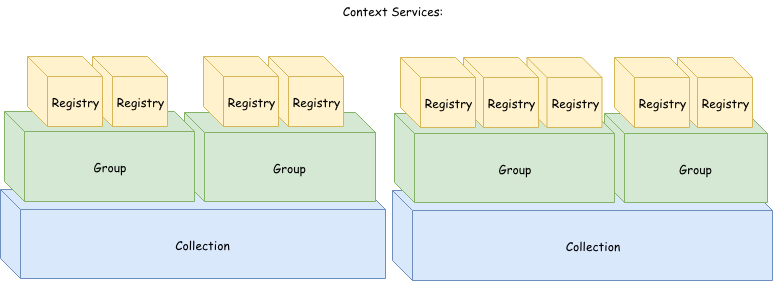
Hence, the context services are each separate calls that get bundled into a neat package for use. Exactly what that bundle looks like and where it gets its data is up to you - This is specified in the database.
For clarity, lets have a look at what retrieving the data would like in a simple JavaScript example
As a start lets look at how easily one is able to retrieve the necessary specified data.
- Create a new file: "PickAName.HTML" anywhere on your computer.
- Create a simple new page with a button to return our data as follows:
- Open your file with any modern browser, click the button, and if all goes well your monitor should be filled with some awesome JSON!
    <!DOCTYPE html>

    <html>
    <button type="button" id="btn">Click me!</button>
    <p class="text">Replace me!</p>

    <script src="https://code.jquery.com/jquery-2.1.1.min.js"></script>
    <script>
        var my_data = '';
        $('#btn').click(function () {
            $('.text').text('loading . . .');
            $.get('https://staging.geocontext.kartoza.com/api/v2/query?registry=group&key=rainfall_group&'+
                'x=24.0380859375&y=-29.375038630898835&outformat=json',
                function (data) {
                    console.log(data);
                    my_data = JSON.stringify(data, null, 2);
                })
                .done(function () {
                    $('.text').text(my_data);
                })
                .fail(function () {
                    console.log('Failed to retrieve data');
                })
                .always(function () {
                    console.log('Request complete');
                });
        });
    </script>
    </html>
Still not impressed? Alright, lets extend the above example to show how easily (using a simple JS library called ChartJS) we can turn that sweet, sweet JSON into something more obviously useful - using some graphs!
- We import the ChartJS library (insert this bellow the line where we import JQuery):
- Next, add a canvas element to our HTML. Let's put it below our "Replace me" paragraph for now.
- Add the function to draw our graph (just above the end of our script looks like a good spot):
- Finally, we need only declare our variables and call our "drawGraph" function when our data is done loading. Amend your above code up until the end of your click's done response as follows:
<script src="https://cdnjs.cloudflare.com/ajax/libs/Chart.js/2.7.3/Chart.bundle.min.js"></script>
<canvas id="myChart"></canvas>
    function drawGraph(data, labels, heading) {

       var ctx = document.getElementById("myChart").getContext('2d');
       var myChart = new Chart(ctx, {
           type: 'line',
           data: {
               labels: labels,
               datasets: [{
                   label: heading,
                   fill: false,
                   data: data,
                   spanGaps: true,
                   backgroundColor: [
                        'rgba(0, 100, 255, 0.2)',
                   ],
                   borderColor: [
                        'rgba(0, 100, 255, 0.2)',
                    ],
                   borderWidth: 0.5
               }]
           },
       });
    }
   var my_data = '';
        var data_object = null;
        var values = [];
        var keys = [];
        $('#btn').click(function () {
            $('.text').text('loading . . .');

            $.get(
                'https://staging.geocontext.kartoza.com/api/v2/query?registry=group&key=rainfall_group&'+
                 'x=24.0380859375&y=-29.375038630898835&outformat=json',
                function (data) {
                    console.log(data);
                    my_data = JSON.stringify(data, null, 2);
                    data_object = data;
                })
                .done(function () {
                    $('.text').text(my_data);
                    $.each(data_object.services, function (index) {
                        values.push(this.value + 0);
                        keys.push(this.key);
                    });
                    var data_heading = data_object.key;
                    drawGraph(values, keys, data_heading);

                })
        })